 Dageno AI
Cross-Model and Regional Benchmarking
Compare your brand's visibility, rank, and leading competitors across AI models and regions to decide where to investigate and improve first.
An average can hide where your brand's position changes
Different AI models and regions can show different answers, sources, and competitors. Separate rankings let you see where your brand appears often, where it trails the leader, and where it is missing.
Guide card — explains why separate model and region views matter. Not product UI
Compare visibility across AI models
Review your brand’s rank and visibility for each model. Check the answer sample and research settings before interpreting a difference.
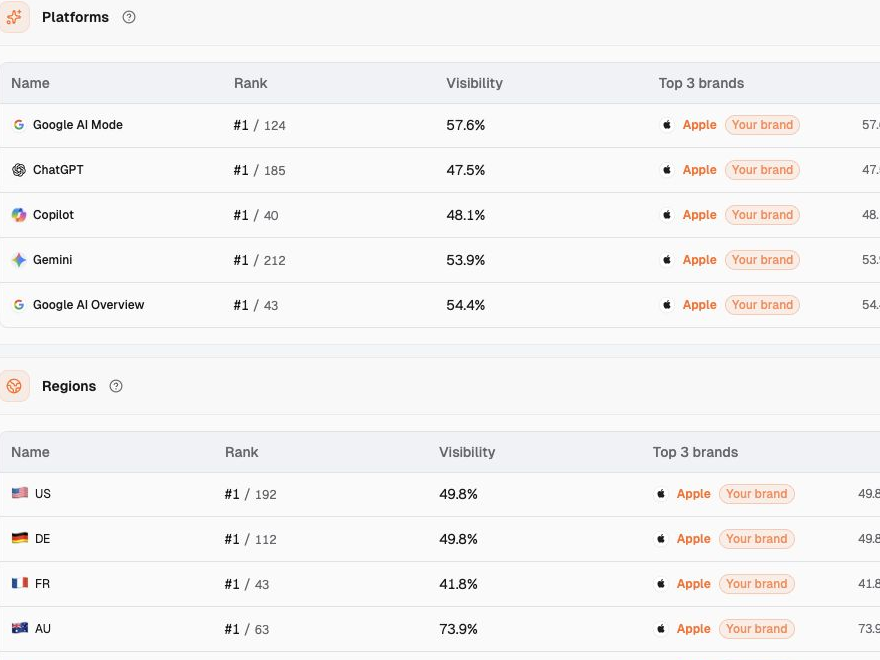
Platforms view: rank and visibility by AI model. Sample · Smart Watches
See where your brand stands in each region
Compare local rankings and visibility. A strong global result can hide a weaker position in a particular market.
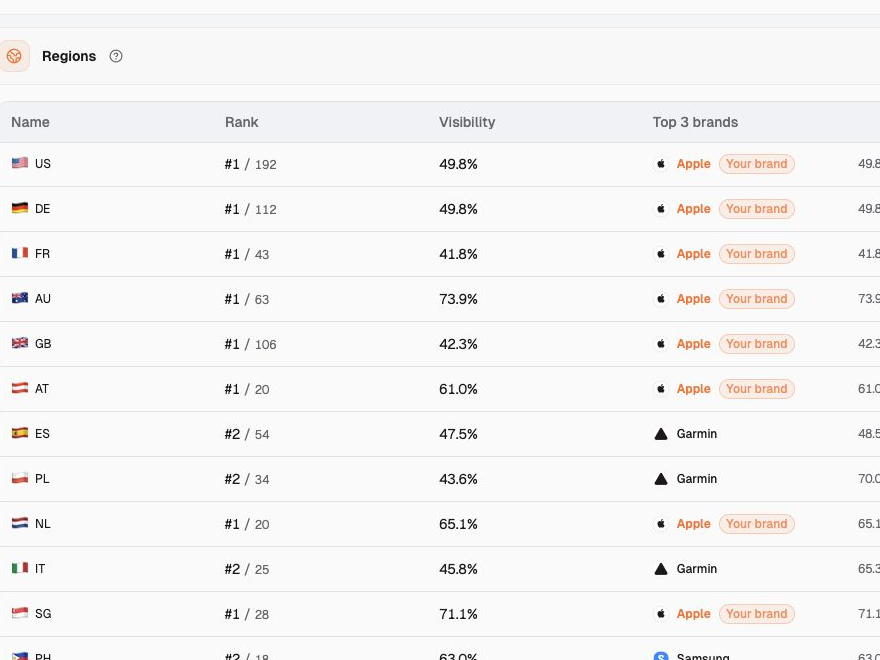
Regions view: rank and visibility by country. Sample · Smart Watches
Keep comparison settings consistent
Keep the market, questions, and dates consistent. When comparing regions, record the language used in each one so you can explain differences.
As new answers are collected, compare periods of equal length using the same questions and settings.
Checklist of settings to keep aligned when you compare. Not product UI
Decide which AI models and markets need attention first
Read the answers and cited pages where your brand falls behind. Then choose which model or region to investigate, which local pages to improve, and which results to monitor.
Step card — a practical order after you spot a gap. Not product UI
Common questions
What does this comparison show?
It shows how often each AI model or region mentions your brand, where it ranks, and which brands lead. You can also see the number of answers used for each result.
Why not use one overall visibility score?
An average can hide a model that never mentions your brand or a region where a competitor leads. Separate results show these differences and the number of answers behind them.
Can AI visibility be compared across different models?
Yes. Compare the same market and buyer questions, and check each model’s answer count, region, language, and dates. Keep each model’s percentages separate.
Does higher AI visibility mean higher sales?
No. Visibility and rank describe how often a brand appears in collected AI answers. They are not demand, preference, or sales metrics. Use them to decide where to investigate next.
See how Dageno works for your market.
Tell us your brand and market. We’ll reply from support@dageno.ai — or start with a free report on your own.
Find out what AI tellsyour buyers about you.
Enter your brand and domain to start — from $67/mo.